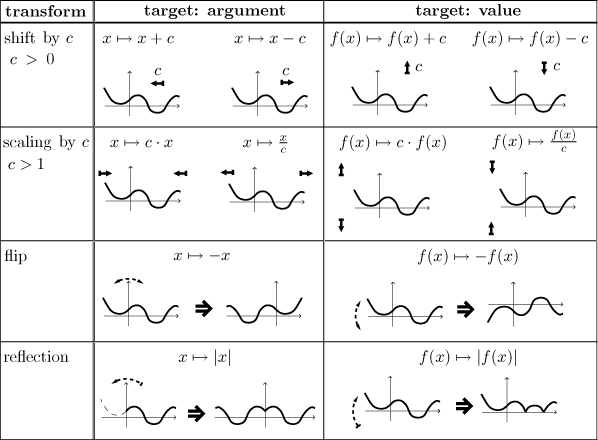
Here we will try to make clear how to guess the graphs of functions that were obtained by applying transformations to known functions. We will not cover functions that are obtained by combining more functions together, since guessing such graphs is difficult, often impossible. The situation we cover here is as follows: We have one elementary function and we apply one or more transforms to it. If you already looked at the note on order of evaluation and the algebraic visualization of functions, it will make sense to you when we say that here we will not guess graphs of functions that are not one chain but have more "roots". Incidentally the order of operations may come handy here as well.
An important part of this section will be the list of transformations and how
they affect the graph.
Since here we are interested in practical application, we will make a
"wrong"
list in the sense that one transformation will be covered several times,
split into special cases. For instance, the scaling
Every transformation works in the same way, by replacing. Every
transformation also comes in two flavours, they can be applied to the
argument or to the value (that is, to a function). For instance, when scaling
by c, we can either replace all x in the formula by

Guessing algorithm
Step 1. Identify the basic elementary function whose graph is the
basis for the function you face.
Step 2. Sketch the graph of the basic function, then modify it
according to all transforms that are applied to the argument
(last to first with respect to the order of operations, see below).
Step 3. Take the graph obtained in Step 2 and modify it according to
all transforms that are applied to the value (first to last with respect to
the order of operations, see below).
One of the most difficult parts for a student is to recognize the correct order in which the transformations should be applied. Typicaly, there would be two transformations applied to the argument, the question then is which one comes first. Fortunately, there is an easy way to find out. If you start with x and apply the replacements as showed above by arrows in the same order in which you modify the graph, you should get the argument in the given function. If you get something else, your order was wrong. This rule also applies if more transforms are applied.
For instance, when guessing the graph of sin(2x + 3), it is a question
whether we should first shift the graph to the left by 3 and then shrink it
twice, or first shrink the graph twice and then shift the resulting thing to
the left by 3. We will now try the replacement business for both:
Shift first, shrink next corresponds to replacement order
in the second step we replace x with
Shrink first, shift next corresponds to replacement order
in the second step we replace x with
We see that the first order is correct for the transformation
| T | f (x) |
| x | |
| x ↦ x − 3: | x − 3 |
| x ↦ 2x: | (2x) − 3 |
Note: If we think of the
order in which we calculate the
given expression, the transformations should be applied "last to first".
Indeed, if we were to calculate the expression
Example: Guess the graph of the function
![]()
Solution: First we identify the core function. Since transformations
do not allow us to divide, we should start with the fraction
Now we have to apply transformations that change the argument x, we
need to change it into
This does not fit, so we have to do it the other way around, first shift, then shrink.
Indeed, "− 2" is done last (after "3 times"), so by the rule we should start with it (shift). Thus we do this:
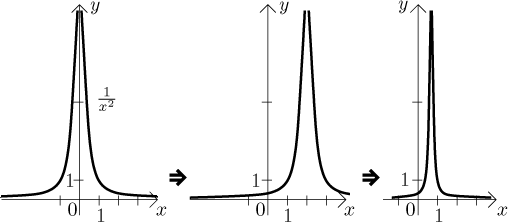
There is sort of a check whether we got it right. The function
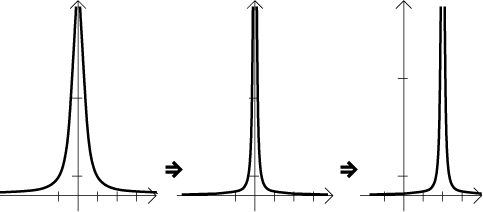
In particular, the hole in the domain does not fit.
Now it is time to apply transformations to the value. There are three of them, vertical scaling by 4, shift down by 1 and mirroring using absolute value. The absolute value is calculated last, so it will be also the last one. The "first to last rule" says that we should scale the graph by 4 vertically, then shift down by 1 and then mirror. We check that the replacements work:
![]()
We got the right thing at the end, so we do it. First the scaling and shift,
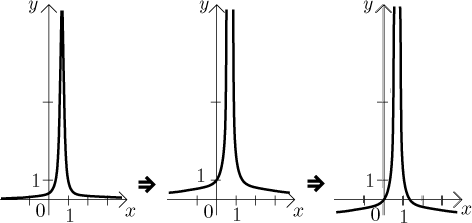
finally the reflection.
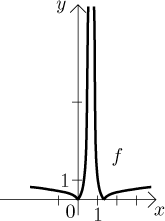
It helps to keep track of some important points during those steps, we may
try to substitute zero or check on zero points. Here we just check at the end
that the zero points of the given function are
Here we will cover three more transformations. They are rather advanced and in most calculus courses they do not work with them. We put them here because they are sometimes useful to know (they helped me a few times) and the section would not feel complete without them.
Squaring. Here is the situation: We know the graph of some function
f. How does the graph of
The square power combines two effects. One, it changes all negative values
into positive, so we should start by mirroring the negative parts of the
graph of f up above the x-axis. The second effect is that of
scaling, but unlike the above cases, the scaling is not by a common factor.
Briefly, the larger the value of f, the more it gets enlarged by
squaring. For instance, in places where f is 10, the graph gets scaled
vertically 10-times, at places where f is 1 the squaring does not
change it at all, and at places where f is
1. First, mirror the graph just like when drawing
2. The points where
3. The points where
4. The points where
If it is done properly, then the monotonicity of the graph of
Example: On the left we show the graph of some funkce f, we also mark the effect of mirroring and the level 1. On the right, the graph of f 2.
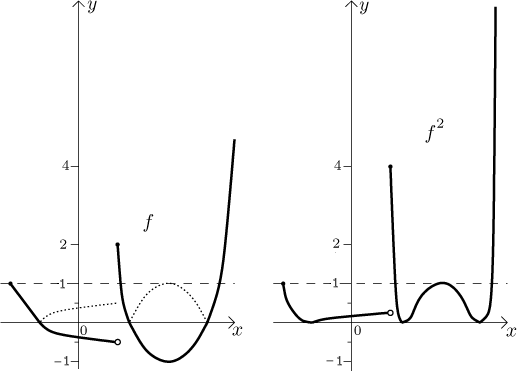
Note: The effect of other integer powers greater than 1 is similar. Even powers work exactly the same, just the stretching and squeezing effect is greater for powers greater than 2. Odd powers greater than 1 have the same stretching/squeezing effect, but without mirroring.
Taking square root. Here is the situation: We know the graph of some function f. How does the graph of the root of f look like?
The square root can be only applied to functions that do not have negative values. Here we have to remember that square root makes numbers larger than 1 smaller, but enlarges numbers smaller than 1. This suggests the steps:
1. The points where
2. The points where
3. The points where
If it is done properly, then the monotonicity of the graph of
Example: On the left we show the graph of some function f, we also mark
the level 1. On the right, the graph of
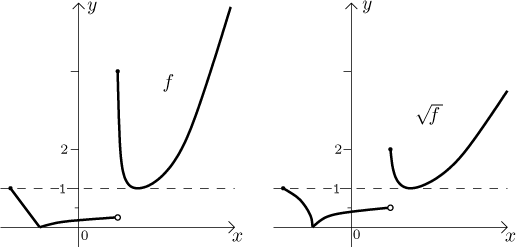
Note: The effect of other roots is similar. If n is an even positive integer, then the n-th root works just like the square root. If n is odd, then the n-th root has similar effect, but now it can be applied to all functions and their negative parts get affected in exactly the same way as we transformed the positive parts.
Taking reciprocals. Here is the situation: We know the graph of some
function f. How does the graph of
The reciprocal can be only applied to functions that are not zero. We know that large numbers are turned into small ones and vice versa by the reciprocal value, but they keep their signs, which suggests what we should do.
1. Divide the graph into horizontal strips. The first strip is the
area given by
2. The points where
3. The parts of the graph that are in the first two strips
exchange places. Points that were close to the level
4. The two strips in the lower half will be treated exactly as in
3., just now everything is and stays negative.
If it is done properly, then the monotonicity of the graph of
Example: On the left we show the graph of some function f, we also mark
the level 1. On the right, the graph of

Note: Putting the ideas of 1 - 3 together we now can guess also negative integer powers and roots.
An experienced graph guesser would also know how to handle things like
For more examples see Solved problems.