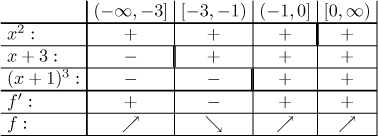
Let f be a "reasonable" function, which here means that its domain consists of at most countably many intervals, on each of which the function is differentiable. We want to determine intervals of monotonicity and local extrema.
Algorithm:
Step 1. Identify intervals of the domain of f.
Step 2. Find the derivative f ′. Find critical points,
that is, points where
By the way, it is not necessary to exactly identify points where the
derivative does not exist. It is enough to include all points where the
existence is suspect; if we put in some extra points, they will be discarded
in subsequent steps (see connecting adjacent intervals of identical
monotonicity).
Step 3. For each of the intervals from Step 2, determine the sign of
the derivative. General method: substitute a point from the interior of such
an interval into f ′ to find the sign.
Special method for a derivative that is a product and/or ratio of factors:
Determine the signs for each factor separately and then multiply the signs
using the standard sign algebra. This is best done using a table (see Example
below).
Step 4. Determine monotonicity from the signs of f ′. The
function f is increasing on intervals where f ′ is positive.
It is decreasing on intervals where f ′ is negative.
When there are two adjacent intervals of the same monotonicity, check whether
these can be connected (for instance, if the function is continuous at the
meeting point of the two intervals, then we can always connect). When writing
the intervals in the answer, include endpoints where f is continuous
from the appropriate side.
Step 5. Determine local extrema. Local minima are all points from the
domain where f changes from decreasing to increasing and is
continuous. Local maxima are all points from the domain where f
changes from increasing to decreasing and is continuous. In case of critical
points where f is not continuous further analysis is necessary.
For background for this algorithm see Monotonicity and local extrema in Theory - Graphing.
Example: Investigate monotonicity and local extrema of
![]()
Solution:
![]()
Critical points:

We see two adjacent intervals of the same monotonicity, so we should ask whether they can be connected. Since f is continuous at 0, they can.
Conclusion: f is increasing on
Note: f also changes monotonicity at −1, but this point is not in the domain, so it is not a local extreme. By the way, if you want to see how this function looks like, check out the Example in Methods Survey - Graphing - Overview).
Remark: The table method has one particular advantage, it is not
necessary to substitute points from intervals into the derivative (or its
factors). If a factor is linear, then it changes sign only once, namely at
the point where this factor is zero. Thus it is enough to mark this dividing
point in the table and then put one kind of a sign to the right and opposite
signs to the left. Should it go − + or + −? That's easy to see, it is enough
to substitute some number other than the dividing point, once can even ask
what happens when x grows to infinity, does the factor become positive
or negative? For more insight see Sign inequalities in the section
Solving equations and
inequalities in Extra. This possibility
of avoiding substituting numbers from intervals can be quite useful in case
of a small interval, for instance there is no nice integer to substitute
from the interval
For other examples see Monotonicity and local extrema in Theory - Graphing and appropriate problems in Solved Problems.
Concavity and inflection points
Back to Methods Survey - Graphing
functions